These results exclude the 5th of November.
The firework reports can be mapped by town. As people submitted a date and time with each report, the date of reports can be plotted on a map of New Zealand. For brevity, these are referred to as “complaints”.
The information presented here is a large underestimate of the number of people negatively affected by fireworks. In order to fill out the fireworks report, the person must:
- know that the fireworks report exists, and
- be able to enter the information, for example to navigate to the page.
For example, a person may be in a location with only a cellphone when the fireworks affect them. The fireworks report is much more difficult to complete on a phone. The person would need both to remember the time and location of the fireworks and be motivated to complete the report at a later time.
As the maps are interactive, allowing you to drill down into each town associated with complaints on that day, I have split the graphs by island. This enables the graphs to have a smaller size, and be embedded into the pages on my website.
All duplicate complaints have been removed prior to these analysis. A duplicate is a complaint for the same place, with the same complainant name (may be blank) for exactly the same day/time. Of these, over half had a name recorded. Of the 5,333 duplicate records removed, 5001 had the same date/time of report–which was recorded to the minute, and captured automatically.
For the geographic analyses, all complaints that could not be assigned to a specific location were removed. The vast majority of these were due to the person entering a single place name, typically a suburb, which exists in multiple locations in New Zealand. An example is Avondale, which is both a suburb in Auckland and a suburb in Christchurch.
1 November 2018
This map is a baseline, as the firework complaints occurred the day before the 2018 date for the legal sale of fireworks. As you can see from the map, a small number people are using fireworks before they are legally permitted to be sold.
2 November 2018
These are the complaints on the first day of the year that fireworks can be legally sold. As you can see, the use of fireworks negatively affects others from the first day of sale.
This is the day with the third-largest number of reports: 81 (South Island data).
3 November 2018
More people in more locations are reporting that fireworks are negatively affecting them. This is the second day of legal sale.
This is the day with the second-largest number of complaints: 88 (South Island data).
4 November 2018
This is the third day of legal sales. People are continuing to report being affected by the fireworks use of others.
This is the day with the fourth-largest number of complaints: 63 (South Island data).
The most common 2018 day for fireworks: 10 November
There were 94 complaints about fireworks on this day (South Island data). This is the first Saturday after Guy Fawkes night.
Overall pattern of firework use
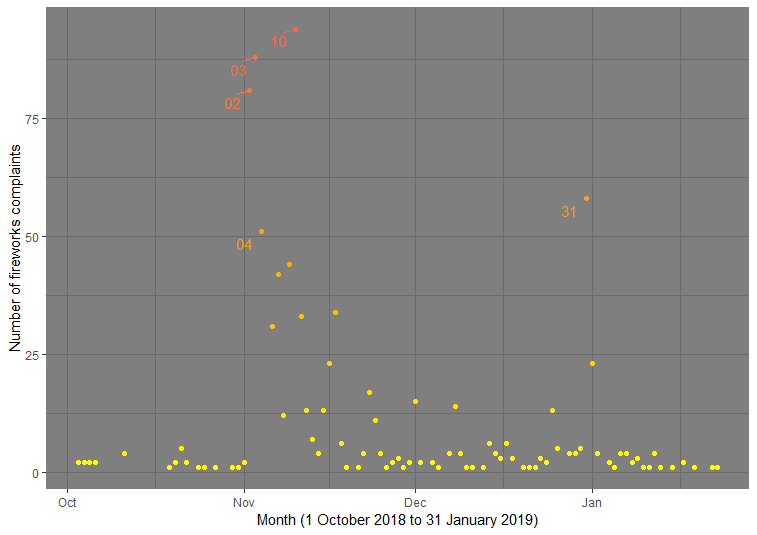
The number of complaints about fireworks, in the period 1 October 2018 to 31 January 2019, are shown below. Days with more than 50 complaints are labelled with the date. Fireworks are being used every day. This is especially true in November, with 4 days having more than 50 complaints. New Year’s Eve is another high-use fireworks day.
Fireworks are being used every day during this 4-month period. This includes days when total fire bans are in place.
Conclusion
It is clear that many people are not restricting their firework use to the 5th of November. This is the historic reason for firework sales. Restriction on the sale of fireworks has not translated into a restriction on the use of fireworks.